Much headway has been made on the conversion of my home network monitoring solution. I have actually been able to turn off my previous solution, Zabbix. As I said in my previous post, it is kind of heavy for the 30 hosts I have at home, akin to killing ants with a 20lb sledgehammer. I had set up not only zabbix, but postgresql (it also supports mysql, but pgsql is my preference by familiarity), plus nginx. In a BSD jail on a mini-server, that was a fairly heavy load, with constant writes to the database.
So I set up Monit, which is the individual host client. Each monit client has a built-in webserver, that can only be accessed from the host. I set it up on my desktop and laptop and got familiar with it. It did the basics that I needed, up/down indications, and I set it to watch a few services. Then I set up M/Monit, the front-end for Monit, and got all of the hosts on my network reporting into it. The m/monit interface makes zabbix look positively cluttered. The status page looks like
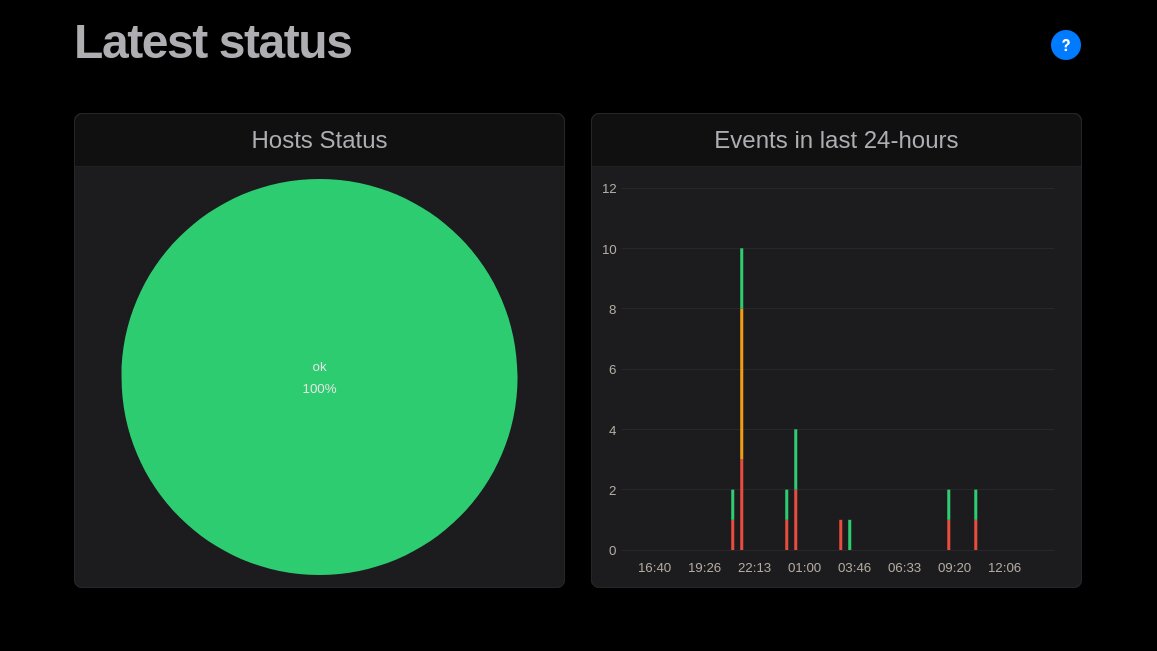
The circle on the left is a pie chart of all the hosts reporting to M/Monit. Each host that M/Monit is watching is represented. M/Monit not only reports on hosts, but also services and files if so configured, and the pie will show indications for the following states:
- Host offline (orange)
- Host with all services offline (red)
- Host with some services offline or in unmonitored state (yellow)
- Host with all services online (green)
- Ignored host (light grey)
- Inactive host (dark grey)
The second pane is all service-related events over the last 24 hours, where
- Red indicates a failure of a service
- Orange indicates a change in a service, for instance a service stop/start/restart, or checksum of a monitored file changes, or a process PID changes
- Green indicates all is right with the world or previous error was fixed
There is also a messages below the two panes, but those clear as soon as the events do.
Clicking on the events will take you to the events page where you can explore happenings on your network.
Across the top of the display are six buttons. On the top left, is a picture of a charming dog, that will take you to the dashboard. On the right is the logout button. in the middle are four buttons.
- Dashboard - Takes you back to the dashboard, like clicking the dog.
- Status - Drills down to the individual host listings. From there, you can look at monitored items for individual hosts.
- Reports - Options include Analytics (performance graphs), Uptime for all hosts on the network, and Events, which will deposit you on the events page.
- Admin - A variety of tools to manage users, groups, hosts, alerts, settings, and the like.
I also wrote an ansible role for my FreeBSD boxes to keep everything working as desired.
So on my todo list, I need to set up email alerting, so I need to revamp my dma (Dragonfly mail agent) to send mail to my mailserver for all of my boxes. Then I need to start growing out my monitoring. I started with the basic suite, got some ideas from my linux install, like making sshd status depend on the condition of the sshd and sftp-server binaries (checking for permissions and checksum changes). I want to set this up for other services on the host. I started with everything straight unencrypted traffic. Then I got M/Monit's interface on ssl/https. So now I'd also like to get the Monit clients talking via ssl to M/Monit.
However, there may be some sand in the gears. While monit and m/monit is, so far, doing everything I want, the elephant in the room is that m/monit requires a license. The license fee for 20 servers is 214 euros, or $250. In their defense, the m/monit license is perpetual, but after a year, you can no longer get updates (without paying again). If I'm honest, I've never even paid that much for the servers in my homelab. Back in the day, most of my hardware was discards from the company I was working for...Until I realized how power hungry 1- and 2U servers were. A 1U server was costing me about $100 a month in electricity. So I am currently using mini-servers like the Lenovo m710q Tiny, which are powered by laptop power bricks. And I bought three of them for 2/3 the cost that m/monit wants for a license.
I did reply to their message and pointed out that many homelabbers are like me and end up finding a tool, and introducing it at work. So for the cost of giving away a 20 seat license, they could end up getting a much larger fish. We have several hundred servers and VMs. I mean, I have already introduced TrueNAS, ansible, and zabbix at work, simply because I had tested and become comfortable with it.
I am figuring this argument will fall on deaf ears. In any case, I guess we shall see in 2 weeks when the trial license times out. I may end up reaching for something else. Perhaps Prometheus and the TICK stack... M/Monit is a great package, however, a little too rich for my shoestring home network.